
 Available in US
Content
What Expected Goals Measures and Why Bettors Need It
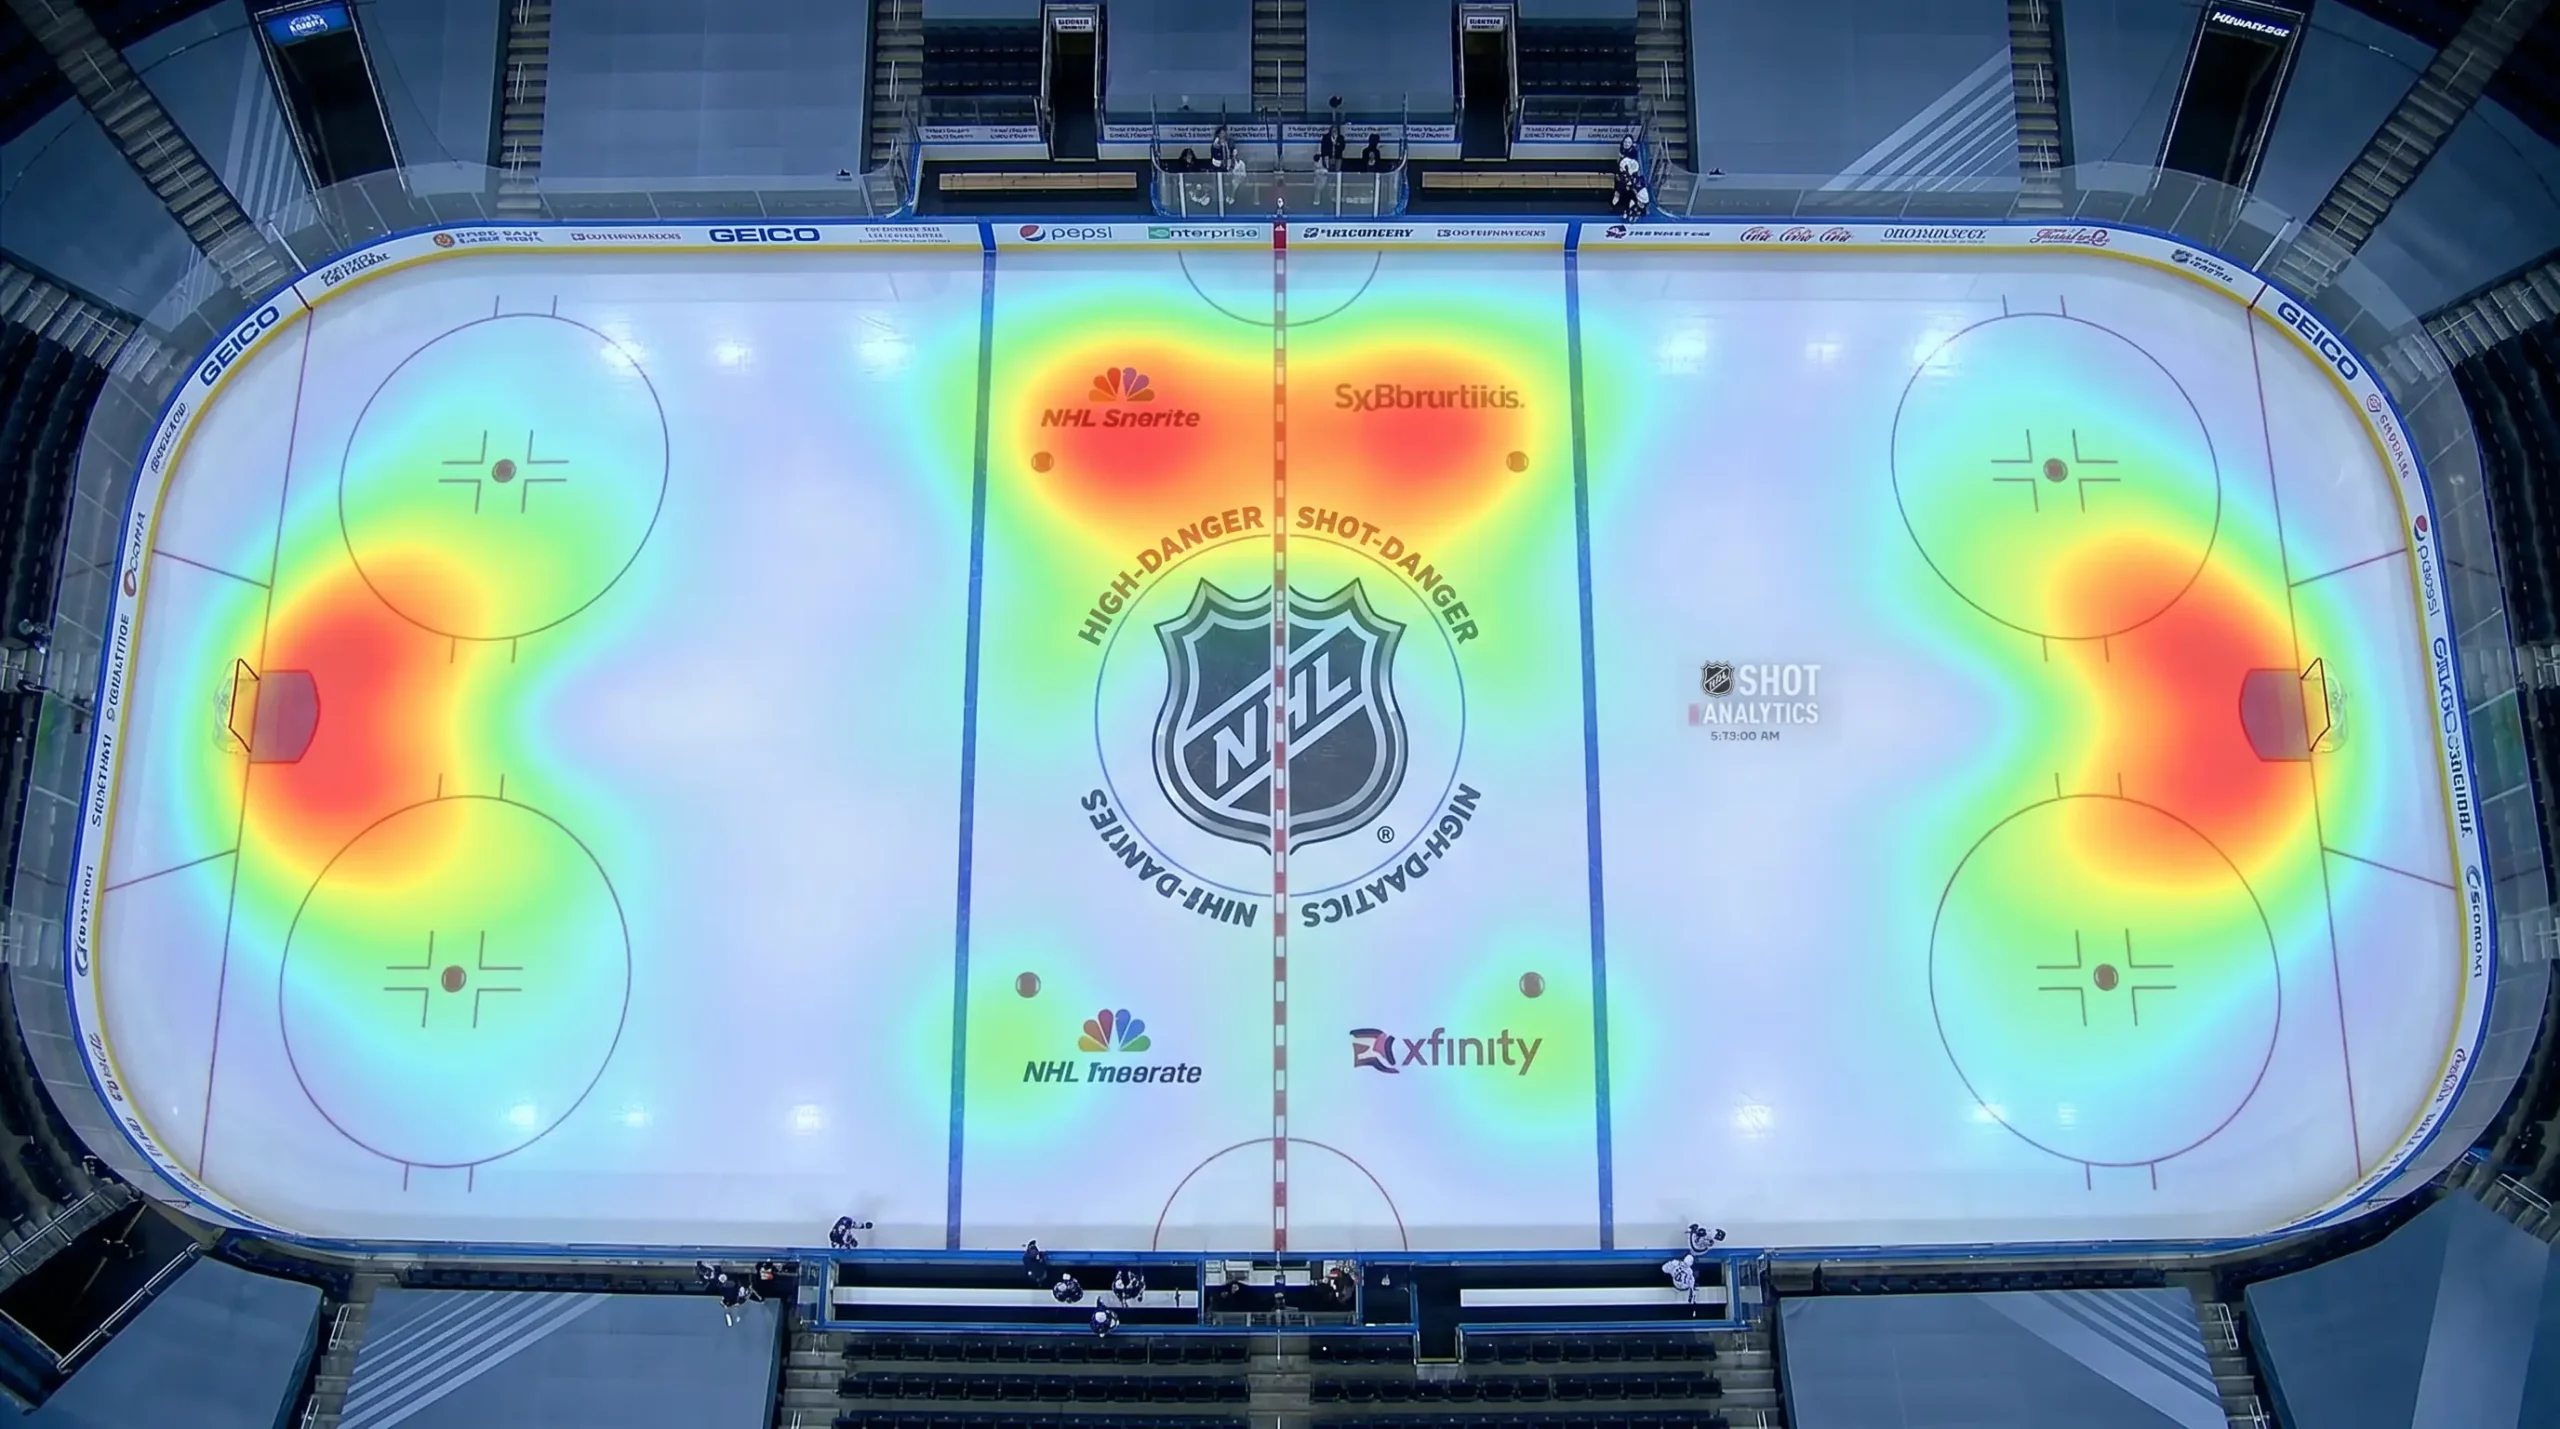
Two teams finish a game with identical shot counts — 30 apiece. One team wins 4-1. The box score offers no explanation, but the expected goals model does. It tells you that the winning team generated 3.2 xG from high-danger chances in the slot, while the losing side accumulated just 1.1 xG from low-quality perimeter shots. Same shot volume, completely different shot quality. That distinction is what xG captures, and it is why bettors who ignore it are working with an incomplete picture.

Expected goals assigns a probability to every unblocked shot based on factors such as distance from the net, angle, shot type, whether the play developed from a rush or a cycle, and whether the shooter was on the power play. A shot from the left circle during a 5-on-3 power play might carry a 0.15 xG value — a 15% chance of becoming a goal. A wrist shot from the blue line might register 0.02. Summing every shot’s xG value across a game or a season gives you a team’s total expected goals, and comparing that to actual goals scored reveals whether a team has been lucky, unlucky, or performing at true talent level.
Teams with an xGF% — expected goals for percentage — above 50% are generating more quality chances than they concede. Elite teams sustain 52-53% or higher at five-on-five. I use xGF% as my primary filter when evaluating matchups, because it strips out the noise of goaltender variance and puck luck and shows me which side is controlling the quality of play underneath the surface.
How an xG Model Works: Inputs, Outputs, and Limitations
I built a crude xG model in a spreadsheet during my fourth year of NHL betting. It was terrible — I was using only shot distance and angle. But the exercise taught me what a proper model requires, and more importantly, what its limitations are.

Modern xG models process enormous datasets. One analysis of the 2022-23 season crunched 114,734 shot events — including shots on goal, goals, and missed shots — to calibrate the relationship between shot characteristics and scoring probability. From those events, 8,474 goals were scored, producing an overall conversion rate of about 7.4%. The model uses that conversion data to weight each factor: shots from the inner slot convert at much higher rates than shots from the perimeter; one-timers beat wrist shots; rush chances outperform cycle plays.

The output is a single number per shot — the probability that an average NHL shooter would score from that exact location and situation. Aggregate those numbers across all shots in a game, and you get each team’s expected goals total. Compare expected goals to actual goals, and you measure the gap between process and outcome.
The limitation I watch for is what xG does not capture: individual shooter talent and goaltender quality. An xG model treats every shooter as average, but elite snipers convert at 12-15% while replacement-level forwards convert at 5-6%. Similarly, xG does not adjust for the quality of the goaltender facing the shots. I compensate for this by cross-referencing xG with GSAx and individual shooting percentages when evaluating specific matchups. The model is a powerful starting point, not the final word.
xG vs. Corsi: When Shot Quality Matters More Than Volume
Corsi measures shot volume — every shot attempt, including those that miss the net or are blocked. xG measures shot quality — the probability of each shot becoming a goal. They answer different questions, and knowing when to lean on one versus the other has sharpened my betting significantly.

Early in the season, Corsi stabilises faster than xG because it tracks a higher volume of events. After 15-20 games, a team’s Corsi percentage is a reasonably reliable indicator of whether they are controlling play. xG takes longer — closer to 25-30 games — because it depends on shot location data that carries more noise in smaller samples. During October and November, I weight Corsi more heavily. By December, I shift toward xG as the sample matures.
The other distinction matters for specific matchups. A team with a high Corsi but mediocre xG is generating a lot of shot attempts from low-danger areas. They control possession but struggle to penetrate the opponent’s defensive structure. Conversely, a team with a moderate Corsi but excellent xG is creating fewer chances but making each one count. For totals betting, the xG-heavy team is more likely to produce goals; for moneyline value, the Corsi-heavy team might be slightly overvalued because their volume looks impressive on paper without translating into quality.
I unpack Corsi and its sibling metric Fenwick in full detail in my Corsi and Fenwick betting guide, including the specific game states where each metric is most predictive.
Applying xGF% to Pre-Game NHL Betting Analysis
My pre-game routine starts with xGF% at five-on-five for both teams, filtered to the last 20 games. I want rolling data, not season-long averages that include early-season noise and pre-trade-deadline rosters that no longer exist. If Team A sits at 54% xGF% and Team B is at 47%, I have a seven-point gap that tells me Team A is dominating the quality of play. That gap does not guarantee a result, but it tilts the probability meaningfully.

I then overlay the moneyline odds. If Team A is priced at 1.65 — implying a 60.6% win probability — and my xGF% analysis suggests they should win closer to 55-57% of the time, the price is too short. If they are priced at 1.90 — implying 52.6% — and my analysis puts them at 57%, there is value. The xGF% comparison gives me an anchor for the true probability, and the bookmaker’s odds tell me whether the market has reached the same conclusion.

I also check how each team’s xGF% performs on the road versus at home. Some teams maintain their process regardless of venue; others see a sharp drop in shot quality when travelling. A team with a 53% xGF% at home but only 48% on the road is a different proposition depending on where the game is played. That split is not always reflected in the bookmaker’s price, especially for mid-table teams that the market does not scrutinise as closely as title contenders.
Why xG Belongs at the Centre of Your NHL Betting Process
Expected goals is not a magic number. It is a framework for evaluating shot quality that, when combined with goaltender data and schedule context, produces a more accurate picture of team strength than any traditional statistic. I have used xGF% as the spine of my pre-game analysis for five years, and my results improved measurably from the day I started. The free data sources available to UK punters make it accessible to anyone willing to spend ten minutes per game reviewing the numbers. That ten-minute investment is the best return on time you will find in NHL betting.
What is expected goals and how do bettors use it?
Expected goals assigns a scoring probability to every unblocked shot based on location, angle, shot type, and game situation. Bettors use xG to compare teams’ underlying quality of play rather than relying on actual goals scored, which are influenced by goaltender performance and random variance.
What xGF% should I look for when backing an NHL team?
An xGF% above 52% at five-on-five generally indicates a team that is controlling play quality. Elite teams sustain 53-56%, while teams below 48% are typically being outplayed. I use a gap of five or more percentage points between two teams as a strong signal for the higher-xGF% side.
Are free xG models reliable enough for betting?
Free xG models from established hockey analytics sites are reliable enough for most betting purposes. They process the same play-by-play data as paid models, though some paid services include additional inputs like pre-shot movement tracking. For the majority of pre-game analysis, free models provide a solid foundation.
